Trust every report before anyone sees it.
KPI Compass continuously validates reports, builds organizational knowledge, and gives people and AI confidence in the numbers they use to make decisions.
Report
Monthly_Revenue.xlsx
Validation
Checked against trusted sources
Knowledge
Metrics & terms captured
Confidence
96% accuracy · verified
AI
Answers with trusted context
The confidence layer most analytics teams are missing
KPI Compass sits between reporting systems and business decisions — validating reports, organizing business knowledge, and giving AI trusted context.
Trusted numbers, ready to share
Validates reports, defines business language, and gives AI trusted context.
How a report becomes trusted knowledge.
Upload the reports your team already produces — board decks, spreadsheets, PDFs, dashboard exports, and Tableau workbooks. KPI Compass reads each one, detects its metrics and formulas, and extracts the definitions, terms, and calculations into your Knowledge Library.
Then it checks every reported number against your source of truth — a warehouse like Snowflake, BigQuery, Redshift, Databricks, or Postgres, or a trusted CSV or Excel export — within the tolerances you set. Anything that doesn’t reconcile is flagged and explained; what checks out is certified as governed knowledge people and AI can rely on.
Upload
Metrics detected
Upload any report — PDF, PowerPoint, Excel, CSV, or Tableau — and metrics are detected automatically.
Validate
98% accuracy · validated
Automatically compare reported numbers against trusted data sources.
Explain
Identify discrepancies and explain likely causes using AI.
Certify
Revenue attributed to advertising per dollar of ad spend.
Turn reports, metrics, and business terminology into trusted organizational knowledge.
Know your reporting is healthy in seconds.
KPI Compass continuously monitors reporting health so your team can focus on decisions instead of manual checking.
- Everything validated
- No critical discrepancies
- 18 reports verified
- 247 knowledge entries current
Reporting Confidence
18
Reports verified
247
Knowledge entries current
Recent validation activity
- Monthly Revenue Report verified4m ago
- Connected sources synced1h ago
- Marketing Performance — discrepancy resolved2h ago
Build organizational knowledge automatically.
Every validated report expands your organization’s shared understanding — captured as you work, then searchable and connected.
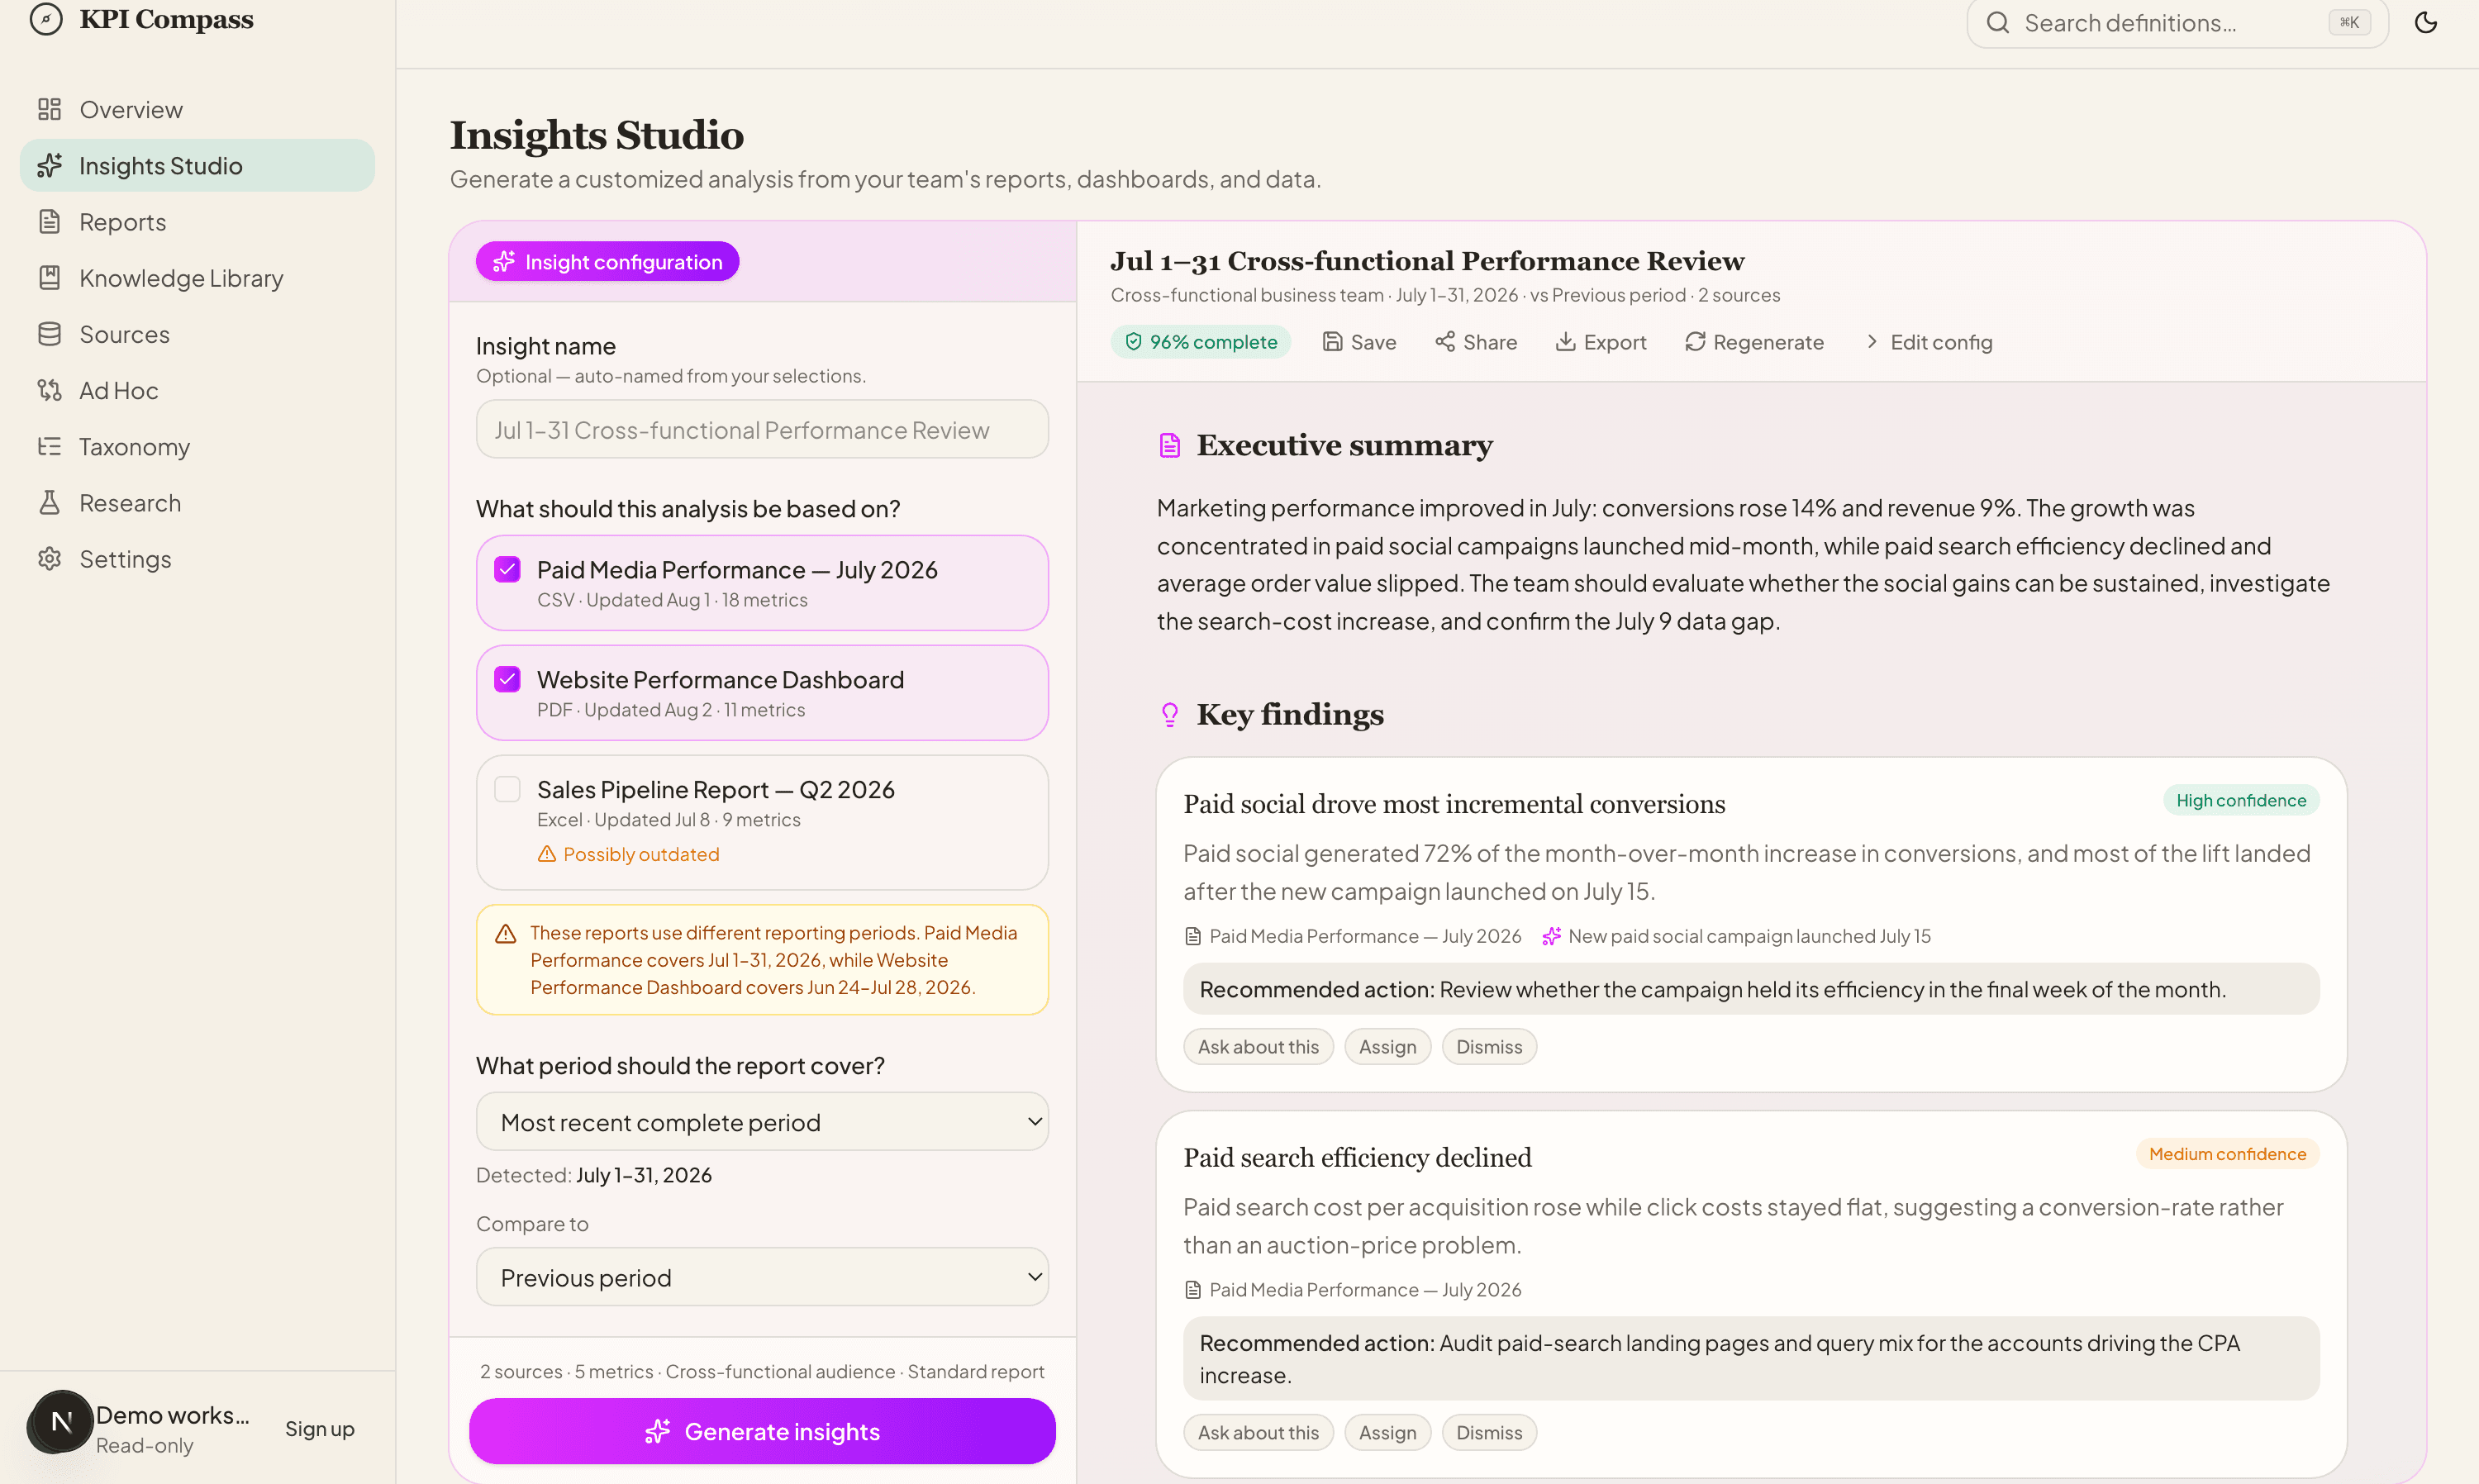
Turn reports into a decision-ready brief.
Select your reports, the metrics that matter, the audience, and the business context. KPI Compass generates a structured insight report — findings, evidence, and recommended actions — that you refine through chat.
Built for business teams.
Designed for the people responsible for producing, reviewing, and sharing business reporting — not just the teams maintaining data infrastructure.
Integrates with your existing stack.
Works alongside your existing analytics investments.
Why KPI Compass is different.
- Trust dashboards blindlyValidate every report
- Static documentationLiving Knowledge Library
- Manual QAAutomated validation
- Definitions scattered across docsCentral source of business knowledge
- AI guesses business terminologyAI uses validated organizational context
Questions, answered.
- Is this a semantic layer?
- No. A semantic layer defines how metrics are computed; KPI Compass validates that the numbers in your reports actually match your trusted sources, and turns them into governed knowledge. It sits above your semantic layer, not in place of it.
- Does KPI Compass replace Tableau?
- No — it works alongside it. Tableau builds dashboards; KPI Compass validates the numbers those dashboards and reports show. Upload Tableau workbooks (.twb/.twbx) and calculated-field formulas are parsed exactly from the XML.
- Can I connect Snowflake?
- Yes. Connect Snowflake, BigQuery, Databricks, Redshift, Postgres, and more as trusted sources, then validate reported numbers directly against them.
- Can AI answer questions using our company terminology?
- Yes. The AI Consultant answers from your validated reports, certified definitions, and trusted sources — with citations — so it uses your organization's context, not generic internet knowledge.
- How are discrepancies detected?
- You map a reported metric to a source value and a tolerance. Accuracy checks compare the two, flag anything outside tolerance as a discrepancy, and explain the difference with a suggested resolution.
- Can I validate Power BI dashboards?
- Yes. Bring in exports and reports from Power BI, Looker, and other BI tools, then validate the metrics they present against your trusted sources.
- Does this replace a data catalog?
- It complements one. A catalog documents where data lives; KPI Compass builds a living Knowledge Library of validated metrics, terms, and reports — governance that grows from the reporting work your teams already do.
The confidence layer for modern analytics teams.
Build trust in every report, every metric, and every business decision.